
25
2022
-
03
Effects of calcium citrate on production performance and bioavailability evaluation of early weaned piglets
Abstract: This experiment was designed to study the effects of different dietary calcium sources and levels on production performance and blood biochemical parameters of 7-8kg DLY early weaned piglets and the effects of different calcium sources and levels on calcium utilization in piglets. 90 21-day-old weaned piglets (weight:
7.0 ±0.5 kg) were selected. They were randomly divided into 14 treatments, 7 treatments of calcium carbonate and 7 treatments of calcium citrate. The dietary calcium levels were 0.5%,
0.6%, 0.7%, 0.8%, 0.9%, 1.0%, and 1.1%. The experiment lasted for 35 days. The results showed that: (1) With the increase of dietary calcium level, the average daily weight gain and feed intake of piglets first increased and then decreased. The comprehensive production performance of piglets in the calcium carbonate group was the best at the Ca 0.9% level; the comprehensive production performance of piglets in the calcium citrate group was the best at the Ca 0.8% level. The average daily weight gain of piglets in the calcium citrate group was higher than that in other calcium carbonate groups, but there was no significant difference (P>0.05). (2) The serum calcium concentration in the calcium citrate group at Ca 0.9% was significantly higher than that in other calcium levels (p < 0.05). The serum inorganic phosphorus concentration first increased and then decreased with the dietary calcium level. Both calcium sources were significantly higher than the other groups at Ca 0.9%, and there was no significant difference between the two groups (p > 0.05). The serum alkaline phosphatase activity in the calcium carbonate group at Ca 0.9% was significantly higher than that in the other groups (P < 0.05), and in the calcium citrate group at Ca 0.8% was significantly higher than that in the other groups (P < 0.05), but there was no significant difference between the groups (P > 0.05). (3) The calcium utilization rate of the calcium carbonate group with a Ca 0.9% level was higher than that of the other groups, but there was no significant difference (P>0.05). The Ca 0.9% level of the calcium citrate group was significantly higher than that of the other calcium level groups within and between groups (P<0.05). The phosphorus utilization rate of both calcium source groups reached the highest level in the Ca 0.9% level group, but the calcium citrate group was significantly higher than the calcium carbonate group (P<0.05). The above results show that the calcium requirement for the growth of 7-8kg weaned piglets is 0.9%. Calcium citrate is a better calcium source than calcium carbonate.
Keywords: calcium citrate, weaned piglets, production performance, utilization
Calcium is the main substance that makes up animal bones and teeth. It participates in bone metabolism[1] and plays an important role in other life activities of the body. It is a mineral element necessary for animals. At present, inorganic calcium is mainly used as a calcium source in animal husbandry production. Among them, calcium carbonate is the most widely used due to its high calcium content, safety, effectiveness, and especially low price. However, calcium carbonate is alkaline and has low solubility. It must react with a large amount of acid in the stomach to generate ionized calcium before it can be absorbed. In young animals, the digestive system is not fully developed, and the gastric acid secretion capacity is not as good as that of adult animals. The pH value in the stomach is higher than that of adult pigs, which directly affects their absorption of calcium. Especially for early weaned piglets, weaning stress causes a significant increase in the pH value in the stomach. Calcium citrate, as a new calcium preparation, has been widely used in medicine and human calcium supplementation at home and abroad. Compared with calcium carbonate, calcium citrate, as a calcium nutritional enhancer, has good solubility, low gastrointestinal irritation, and high hygienic safety[2]. Studies have shown that the solubility of calcium citrate is even 10 times that of calcium carbonate[3] [4]. It is generally believed that the more soluble the calcium source, the higher the biological value. Many scholars have shown that calcium citrate is not as dependent on gastric acid as calcium carbonate[5], and can even be dissolved in water[6]. Therefore, for early weaned piglets with insufficient gastric acid secretion, calcium citrate will be a better calcium source. Providing sufficient calcium sources in the diet can ensure the normal growth of livestock and poultry, but the larger the amount, the better. Too much calcium cannot increase the calcium absorption effect, but will also lead to slow growth and bone diseases in animals. Moreover, excessive calcium combines with fatty acids to form soap calcium, which affects the digestion and absorption of fat and causes metabolic disorders of phosphorus, iron, magnesium and other elements in the body. Therefore, in livestock and poultry production, effectively evaluating the bioavailability of different calcium sources at different physiological stages of different animals to determine their appropriate addition amount is not only a need for effective utilization of calcium itself, but also the basis for ensuring the full utilization of other nutrients.
1 Materials and methods
1.1 Experimental materials
Calcium citrate was provided by Guangxi Nanning Zewell Feed Co., Ltd., and calcium carbonate was feed grade.
1.2 Experimental animals and grouping
90 21-day-old weaned piglets (weight: 7.0 ± 0.5 kg) were selected. 84 of them were randomly divided into 14 treatments, with 3 replicates in each treatment and 2 pigs in each replicate. The remaining 6 pigs were randomly assigned to 2 treatment groups with a calcium level of NRC standard (Ca 0.8%), with 1 pig in each replicate.
Table 1: Experimental design
| deal with | Calcium Citrate | Calcium carbonate | |
| Treatment dietary calcium level % | 1 | 0.50 | 0.50 |
| 2 | 0.60 | 0.60 | |
| 3 | 0.70 | 0.70 | |
| 4 | 0.80 | 0.80 | |
| 5 | 0.90 | 0.90 | |
| 6 | 1.0 | 1.00 | |
| 7 | 1.10 | 1.10 |
1.3 Experimental diet
Table: 2 Basic diet composition and nutritional level
| Raw materials | Basic diet (%) |
| Corn | 22.39 |
| Puffed corn | 22.39 |
| Puffed soybeans | 10.00 |
| Soybean meal | 10.00 |
| Soybean protein concentrate | 5.00 |
| Fish meal | 5.00 |
| Whey powder | 10.00 |
| Sucrose | 1.50 |
| Glucose | 1.50 |
| Bentonite | 3.33 |
| Sodium dihydrogen phosphate | 0.33 |
| Salt | 0.35 |
| DL-methionine | 0.07 |
| Lysine hydrochloride | 0.34 |
| Threonine | 0.11 |
| Tryptophan | 0.04 |
| Choline | 0.10 |
| Minerals | 0.50 |
| Multivitamins | 0.05 |
| Mycobacterium sulfate (10%) | 0.002 |
| Total | 100 |
| Nutritional level (%) | |
| Crude protein CP | 19.83 |
| Digestible energy DE (MJ/kg) | 14.09 |
| Calcium Ca | 0.37 |
| Total phosphorus | 0.60 |
| Available phosphorus | 0.40 |
| Total lysine LyS | 1.34 |
| Digestible lysine D-Lys | 1.19 |
| Total sulfur amino acids DSAA | 0.68 |
| Threonine | 0.74 |
| Tryptophan | 0.22 |
1) Phosphorus requirement refers to NRC (1998)
2) Additive premix provides: Fe 100mg; Cu 150mg; Mn 40mg; Zn 100mg; I 0.5mg; Se 0.3mg; VA 18000IU; VD3 4000IU; VE 40IU; VK3 4mg; VB1 6mg; VB2 12mg; VB6 6mg;
VB12 0.05mg; Biotin 0.2mg; Folic acid 2mg; Nicotinic acid 50mg; Pantothenic acid 25mg; Lys-Cl 300g; DL-Met 50g; Thr 80g; Trp 40g per kg diet.
1.4 Feeding management
The experiment was conducted in the piglet nursery of the experimental field of the Animal Nutrition Research Institute of Sichuan Agricultural University. The nursery uses slatted floor nursery equipment, and the house temperature is controlled at 22-25℃, and the relative humidity is controlled at 65%-70%. One week before the test, the pig house and various feeding utensils were thoroughly cleaned, flushed and disinfected, and the ground, fences, pig troughs and other facilities were sprayed with caustic soda. Peracetic acid was used for daily pig house disinfection. During the test, the pens were kept ventilated, clean and dry. Pre-feeding was 3 days, and the main test period was 35 days. The test pigs were fed 4 times a day (8:00, 12:00, 16:00, 20:00), and the feeding amount was limited to a little left in the trough after feeding, and they were free to drink water.
1.5 Determination indicators and methods
1.5.1 Piglet production performance
Feed intake, daily weight gain, feed-to-meat ratio Weigh on the 28th day of the main test period, and record the amount of feed added every day. Calculate the average daily feed intake, average daily weight gain, and average daily feed intake/average daily weight gain to calculate the feed-to-meat ratio.
1.5.2 Blood samples After the test, the fasting pigs were weighed at 8:00 am, and blood was collected from all pigs to separate serum. The Ca, P, and alkaline phosphatase activity in the serum were measured.
1.5.3 Slaughter index At 8:00 am on the 8th day of the test, 4 piglets were randomly selected from each group for slaughter in the Ca 0.8% level group.
(1) Tibia index The calcium and phosphorus in the tibia, as well as the ash content, fat-free dry matter and bone density, tibia volume, and tibia fracture force were measured.
(2) Gastric and intestinal pH The pH of the contents of the stomach, jejunum, and ileum were measured immediately after slaughter using a pH90 direct-insert pH meter.
1.5.4 Metabolic test
At 8:00 am on the 29th day of the test period, except for the Ca 0.6% and Ca 1.0% level groups, 3 healthy piglets with near-average weight were selected from each level and placed in metabolic cages for complete feces and urine collection. The test period was 4 days. The feed intake of the test pigs was 90% of the average feed intake of each treatment in the growth test. The feed volume for 4 days was weighed once and the pigs were allowed to drink water freely. The feed intake, feces and urine were counted every day, and 10% sulfuric acid was added to the feces and urine (10 ml for 100 g of feces and 10 ml for 100 ml of urine). The samples were placed in a refrigerator at 0-4℃ in time. When the collection was completed, the feces and urine of the same pig were mixed together and 1/10 sample was taken. The fecal samples were dried in an oven at 65℃ for 24h, placed at room temperature for 6h, crushed to obtain air-dried samples, and stored in a refrigerator at -20℃ for analysis.
Pig feces and urine samples The fecal calcium content was determined by potassium permanganate titration, and the urine calcium was determined using the calcium determination kit of Nanjing Jiancheng Company. The phosphorus content in feces and urine was determined by the phosphomolybdic acid method.
Calcium apparent digestibility (%) = (total calcium intake - fecal calcium excretion) / total calcium intake × 100
Calcium apparent utilization (%) = [total calcium intake - (fecal calcium excretion + urinary calcium excretion)] × 100 Phosphorus apparent digestibility (%) = (total phosphorus intake - fecal phosphorus excretion) / total phosphorus intake × 100 Phosphorus apparent utilization (%) = [total phosphorus intake - (fecal phosphorus excretion + urinary phosphorus excretion)] × 100
1.6 Data analysis
The experimental data were preliminarily processed using Excel. 7 days after slaughter, the pH value of digestive tract contents was subjected to paired sample T test using SAS9.0 statistical software. Other data were subjected to two-way ANOVA using SAS9.0 statistical software, and Duncan method was used for multiple comparisons. The results were expressed as mean ± standard deviation, and P < 0.05 was considered statistically significant.
2. Results
2.1 Effects of different calcium sources and levels in diets on piglet production performance
Table 4 Effects of different calcium sources and levels on piglet production performance
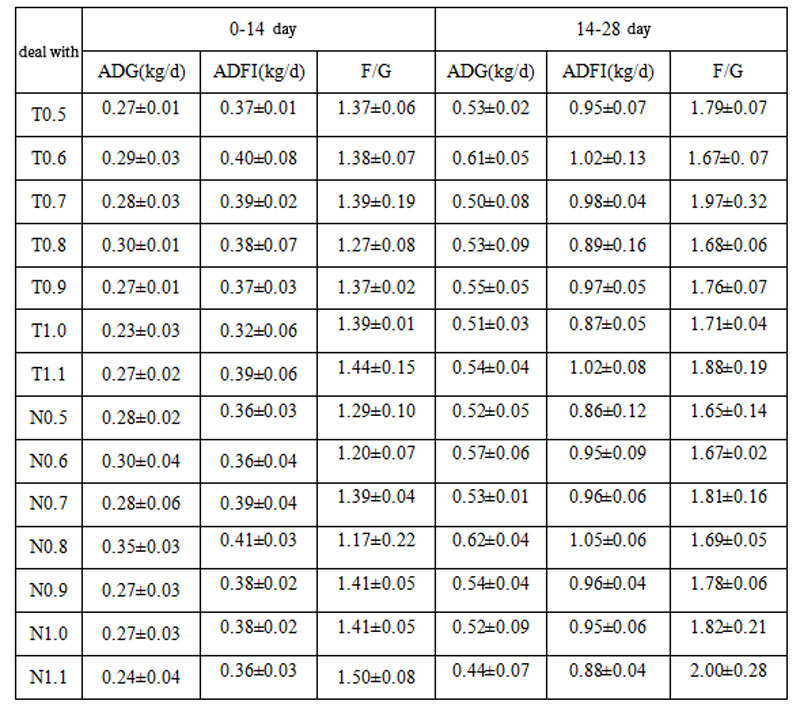
Note: Data in the same row marked with different lowercase letters indicate significant differences (P<0.05), and the same letters or no letters indicate no significant differences (P>0.05)
1: T represents the treatment group with calcium carbonate as the calcium source;
2: N represents the treatment group with calcium citrate as the calcium source.
3: ADG: average daily weight gain; ADFI: average feed intake; F/G: feed-to-meat ratio.
As shown in Table 4, from 0 to 14 days, with the increase of dietary calcium level, the average daily weight gain and feed intake of piglets showed a trend of first increasing and then decreasing, and the feed-to-weight ratio showed irregular changes. In the calcium carbonate group, the average daily weight gain was the highest in the Ca 0.8% group; the feed intake was the highest in the Ca 0.6% group, but close to the Ca 0.8% group; the feed-to-meat ratio was the lowest in the Ca 0.8% group. In the calcium citrate group, the average daily weight gain was the highest in the Ca 0.8% group; the feed intake was the highest in the Ca 0.8% group; and the feed-to-meat ratio was the lowest in the Ca 0.8% group. There was no significant difference in the above indicators (P>0.05). Comparing the calcium carbonate and calcium citrate groups, the average daily weight gain and feed intake of the calcium citrate Ca 0.8% group were higher than those of the other calcium carbonate groups, but there was no significant difference (P>0.05); the feed-to-meat ratio of the calcium citrate Ca 0.8% group was lower than that of the calcium carbonate groups, but the difference was not significant (P>0.05). Comprehensively considering the various indicators of piglet production performance, it is believed that when calcium carbonate is used as the calcium source in the diet of 21-day-old weaned piglets, the appropriate calcium level is 0.8%, and when calcium citrate is used as the calcium source, the appropriate calcium level is 0.8%. In addition, comprehensive consideration of various indicators shows that calcium citrate is more suitable as a calcium source for piglets than calcium carbonate. It can improve the growth performance of piglets.
2.2 Effects of different calcium sources in the diet on pH in the digestive tract of piglets
Table 5 Effects of different calcium sources on the pH of gastrointestinal contents in piglets
| Items | Calcium carbonate Ca 0.8% level | Calcium Citrate Ca 0.8% Level |
| Gastric pH | 3.18±0.63 | 2.19±0.54 |
| Jejunal pH | 6.52±0.24 | 6.57±0.27 |
| Ileal pH | 7.52±0.30 | 7.18±0.29 |
As shown in Table 5, the pH values of stomach and jejunum of piglets in the calcium citrate Ca0.8% group were significantly different from those in the calcium carbonate Ca0.8% group (P<0.05), and there was no significant difference in the pH value of piglet ileum between the two groups (P<0.05).
2.3 Effects of different calcium sources and levels in the diet on the digestibility and utilization of calcium and phosphorus in piglets
Table 6 Effects of different dietary calcium sources and levels on the digestibility and utilization of calcium and phosphorus in piglets
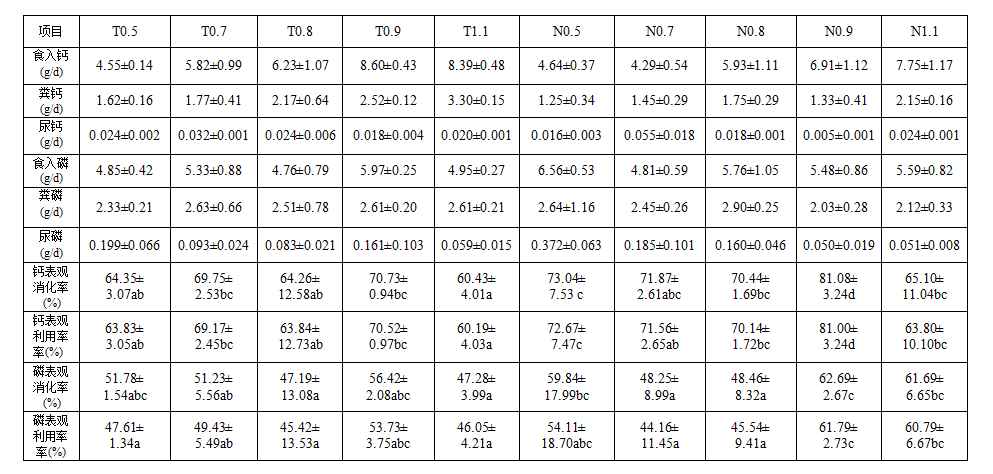
Note: Different lowercase letters in the same line indicate significant differences (P < 0.05), and different uppercase letters in the same line indicate extremely significant differences (P < 0.01)
As shown in Table 6, the calcium utilization rate in the Ca0.9% group of the calcium carbonate group was higher than that in other groups, but there was no significant difference (P > 0.05), and the Ca0.9% in the calcium citrate group was significantly higher than that in the calcium carbonate group and other calcium level groups in the group (P < 0.05). The phosphorus utilization rate of both calcium source groups reached the highest level in the Ca0.9% level group, but the calcium citrate group was significantly higher than the calcium carbonate group (P < 0.05).
2.4 Effects of different calcium sources and levels in the diet on blood biochemical indices of piglets
Table 9 Effects of different dietary calcium sources and levels on serum calcium, phosphorus concentrations and alkaline phosphatase activity in piglets
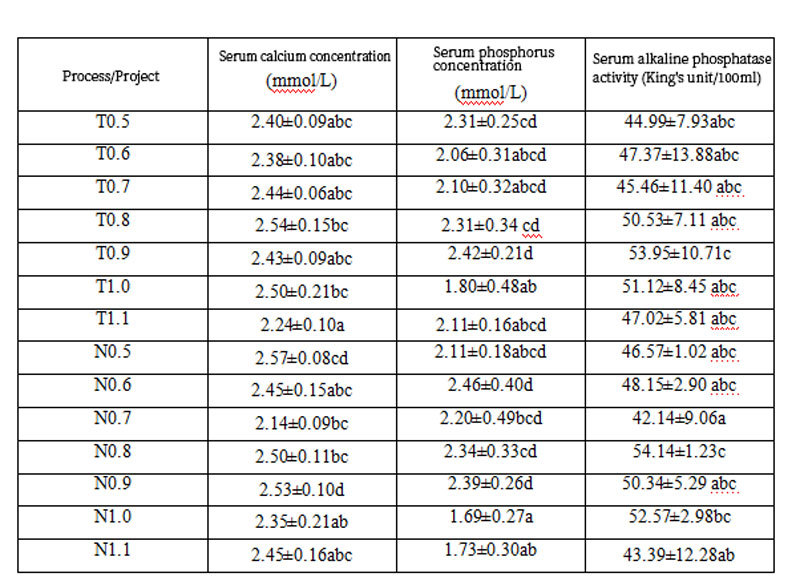
Note: Different lowercase letters in the same line indicate significant differences (P < 0.05), and different uppercase letters in the same line indicate extremely significant differences (P < 0.01);
1: T represents the treatment group with calcium carbonate as the calcium source;
2: N represents the treatment group with calcium citrate as the calcium source.
As shown in Table 9, serum calcium concentration, in the calcium carbonate treatment group, the serum calcium concentration of the Ca0.8% level group was higher than that of other levels, but there was no significant difference among the calcium levels (P > 0.05). In the calcium citrate treatment, the Ca0.9% level group was significantly higher than the other calcium level groups (P < 0.05), and there was no significant difference among the other levels (P > 0.05). Compared with calcium citrate and calcium carbonate, the Ca0.9% level group of calcium citrate was significantly higher than the calcium carbonate groups (P < 0.05), and there was no significant difference among the other levels (P > 0.05). Serum inorganic phosphorus concentration first increased and then decreased with the calcium level of the feed. Serum inorganic phosphorus concentration increased first and then decreased with the increase of calcium level. In the calcium carbonate treatment group, the serum inorganic phosphorus concentration in the Ca0.9% level group was significantly higher than that in other levels (P < 0.05), and there was no significant difference in the levels of other groups (P > 0.05). In the calcium citrate treatment, the Ca0.9% and Ca0.6% level groups were significantly higher than the
Ca1.0% and Ca1.1% calcium level groups (P < 0.05), and there was no significant difference in the levels of other groups (P > 0.05). The comparison between calcium citrate and calcium carbonate treatments showed that the two calcium sources were higher than the other groups at Ca0.9%, but there was no significant difference (P > 0.05). The serum alkaline phosphatase activity was significantly higher in the calcium carbonate group at Ca0.9% level than in other groups (P < 0.05), and significantly higher in the calcium citrate group at Ca0.8% level than in other groups (P < 0.05), and there was no significant difference between the two groups (P > 0.05). Based on the comprehensive serum biochemical indicators, it is believed that the calcium level in the feed is better at 0.9%.
3. Discussion
The results of this experimental study show that calcium citrate is a better calcium source for piglets. Calcium citrate may improve the growth performance of piglets because it significantly reduces the pH value in the stomach and ileum of piglets (P < 0.01), increases the activity of related enzymes in the digestive tract, and thus promotes the digestion and absorption of nutrients. In addition, it may be because the metabolite of calcium citrate, citric acid, participates in the tricarboxylic acid cycle in the body to produce energy and promote the growth of piglets. Kochanowski et al. [7] studied the effect of calcium citrate malate on weaned female mice and found that the experimental group significantly improved the growth performance of female mice compared with the control calcium carbonate group (P < 0.05). Henry et al. [8] also obtained consistent results in their study on calcium citrate malate in young chickens. The above results show that citric acid calcium sources can improve the growth performance of young animals, but the reason needs further study.
As shown in Table 6, the calcium bioavailability of calcium citrate at the Ca 0.9% level was significantly higher than that of calcium carbonate (P < 0.05). This may be because the high solubility of calcium citrate promotes its absorption and utilization by piglets. Studies have shown that the solubility of calcium citrate in water at room temperature is 0.096%, while that of calcium carbonate is only 0.0014-0.0056% [9]. The digestive system of 21-day-old weaned piglets is not fully developed, and the gastric acid secretion capacity is insufficient. Other studies have shown [10] that the acid-binding capacity of calcium carbonate in the main raw material factors of piglets is much greater than that of other raw materials, resulting in a further increase in the pH value in the stomach of piglets. The pH value in the gastrointestinal tract plays a decisive role in the absorption and utilization of calcium, thereby reducing the absorption and utilization rate of calcium carbonate. Pak et al. [6] conducted a study in vitro to simulate the digestive tract environment and showed that the absorption of calcium citrate is not so dependent on gastric acid, and can even be absorbed independently of digestion into the internal environment. At the same time, Smith et al. [3] and Andon [4] and other studies have reached consistent results. The phosphorus utilization rate of the Ca 0.9% group was also significantly higher than that of the other groups (P<0.05), which may be due to the optimal calcium-phosphorus ratio at this time. At this time, the calcium-to-available phosphorus ratio was 2.25:1, slightly higher than the 2:1 calcium-available phosphorus ratio recommended by NRC (1998) for 8-20kg piglets. Whether it is due to differences in piglet breeds and growth environments, further research is needed.
4. Summary
This experimental study found that calcium citrate as a calcium source for 21-day-old weaned piglets can significantly improve the gastrointestinal pH value and growth performance of piglets. The bioavailability of calcium citrate is better than that of calcium carbonate. Therefore, calcium citrate is a better calcium source for 7-20kg piglets. However, the limiting factor for the use of calcium citrate as a calcium source for piglets is its higher price than calcium carbonate. Therefore, whether the increase in daily weight gain of piglets is worth the high price of calcium citrate remains to be further studied.
5 References
[1] Johnslon C C Yr,Miller J Z,Slemenda C W,et al.Calcium supplementation and increases in bone mineral density in children[J].N Engel J Med,1992,(327):82.
[2] Yang Zhen et al. Research progress on iron deficiency anemia and iron supplements [J]. Foreign Medical Science-Hygiene, 2006, (2): 99-101.
[3] Smith KT,et al.Calcium absorption from a new calcium delivery system (CCM)[J].Calcif Tissue Int,1987,(41):351.
[4] Andon, M. A., M. Peacock, R. L. Kanerva, and J. A. S. DeCastro. 1996. Calcium absorption
from apple and orangejuice fortified with calcium citrate-malate (CCM). J. Am.Col. Nutr. 15:313–316.AOAC. 1990. Official Methods of Analysis. 15th ed. Associationof Official Analyti -cal Chemists, Arlington, VA.
[5] Miller Jz,et al.Calcium absorption from calcium carbonate and a new form of calcium (CCM) in healthy male and female adolescent[J].Am J Clin Nu- tr,1988,
[6] Pak CYC, Poindexter J, Finlayson B. A model system fo assessing physicochemical
Factors affecting calcium absorbability from the intestinal tract. J Bone Miner Res.1989;4:119–27.
[7] Kochanowski 1990 B.A. Kochanowski, Effect of calcium citrate-malate on skeletal development in young, growing rats, J. Nutr. 120 (1990), pp. 876–881.
[8] M. H. Henry2 and G. M. Pesti, 2002, An Investigation of Calcium Citrate-Malate as a Calcium Source for Young Broiler Chicks, Poultry Science 81:1149–1155.
[9] Lind 2004T. Lind, B. Lonnerdal, H. Stenlund, I.L. Gamayanti, D. Ismail, R.
Seswandhana and L.A. Persson, A community-based randomized controlled trial of iron and zinc supplementation in Indonesian infants: Effects on growth and development, Am. J. Clin. Nutr. 80 (2004), pp. 729–736.
[10] Ding Hongtao, Zhang Hongfu, Ding Baosen, Zhang Li, Yang Fulin. Study on the acidity model of weaned piglets diet[J]. Chinese Journal of Animal Husbandry. 2005, (6): 18-20.
Previous Page
Previous Page
RELATED PRODUCTS

Contact
Add:No.6, Liangling Road ,Nanning Area of China (Guangxi) Pilot Free Trade Zone


